The state of cancer registry
There are a lot of inefficiencies in healthcare. Case in point: In cancer registry, each state receives up to 300,000 pathology reports per year with several hundreds data elements to capture. These reports are manually classified and abstracted by cancer registrars at the hospital level, state registry level or national cancer registry level. So one of the challenges at the NAACCR hackathon was to build an NLP to classify the anatomical sites of cancer from each pathology report.
This is simple enough, but cancer registry requires 100% accuracy. You can tweak and mold the NLP model as much as you want and can get to say 95%. But how do you know where the 5% incorrect classifications are? In real life there is no test set and there is no way to know which 50 of the 1000 reports you’re getting wrong.
My pitch to the judges was to employ a two-pronged approach: We build an NLP method that incorporates two algorithms: Support Vector Machine (SVM) and Convolutional Neural Networks (CNN). Each of these algorithm by itself are about 94% accurate on the validation set. We will then print out the records where the two algorithms disagree. These are the ambiguous reports that need attention from an actual trained cancer registrar. The cancer registrar will then review the reports and decide the final classification for the reports. By using NLP, we can improve efficiency tremendously; yet, we’re still able to maintain quality and accuracy by having a cancer registrar doing the review on the toughest cases.
After the presentation, I have so many cancer registrars coming to me expressing their enthusiasm and endorsing the idea of having machine learning and human working in tandem. My team got second prize in the end but the overwhelmingly positive feedbacks were a clear sign of opportunities in cancer registry in particular and healthcare in general.
The codes
Done using Python
Import packages, file and explore file
import numpy as np
import pandas as pd
import matplotlib.pyplot as plt
import string
import seaborn as sns
import collections
import os
# nltk.download("stopwords")
from nltk.corpus import stopwords
from nltk.stem.snowball import EnglishStemmer

from sklearn.feature_extraction.text import TfidfVectorizer
from sklearn.decomposition import TruncatedSVD
from sklearn.decomposition import PCA
from scipy import sparse as sp
from sklearn.model_selection import train_test_split
from sklearn.feature_extraction.text import CountVectorizer
from sklearn.feature_extraction.text import TfidfTransformer
from sklearn.naive_bayes import MultinomialNB
from sklearn.pipeline import Pipeline
from sklearn.linear_model import SGDClassifier
from sklearn.multiclass import OneVsRestClassifier
from sklearn.model_selection import cross_val_score

# get working directory and set up path for files
working_dir = os.getcwd()
data_dir = os.path.join(working_dir,'data')
train_file = os.path.join(data_dir,'train.csv')
train = pd.read_csv(train_file)
We’ll take a look at the dataframe to see have an idea about our dataset.
# explore dataset
np.shape(train)
train.columns
train.info()
train.head
train.SITE.describe()
train.TEXT_PATH_STAGING_PARAMS.describe()
train.SITE = train.SITE.astype('category')
train.dtypes
A few columns dont contain any useful data and relevant texts are in a several different columns. We’ll create a new dataframe with the useful columns extracted and join them into one column for processing later.
### Preprocessing steps ###

# explore frequency of labels
train.SITE.value_counts().plot('bar')

def preprocess(df):
    """
    take raw df and concat columns to get a column with all relevant texts
    :param df: pandas.DataFrame
    :return: pandas.DataFrame
    """
    # extract columns with relevant texts
    new_df = df.iloc[:,np.r_[1, 6:13, 14]]
    del df
    # concatenate columns together to get one text field
    # use fillna so empty cells wont be joined as 'nan'
    cols = list(new_df.columns)[1:]
    new_df['text'] = new_df.iloc[:,1].fillna('').str.cat(new_df[cols].fillna(''))

    # check if all columns are joined correctly
    print(new_df.loc[50][9])

    return new_df

train_extract = preprocess(train)
Next we’ll want to do some text processing like lowering cases, remove stop words, do word stemming. You can use packages like NLTK to tokenize the texts and let them take care of these steps but I prefer to kind of diy so i can remove exactly the characters and words i want. Plus it’s nice to be able to visualize the most common words in each category that way.
# remove stop words and words with 3 characters or less
stop_words = list(stopwords.words('english'))
# 179 words
remove_words = stop_words

# stemming words
sno = EnglishStemmer()

# function to replace punctuations, digits, and white spaces with blanks
def process_text(variable):
    """
    do text processing: lower case, remove digits, punctuations, white space characters, stop words etc
    :param variable: Pandas series in a dataframe
    :return: Pandas series in a dataframe
    """
    # use str method on series to get lowercase
    variable = variable.str.lower()

    # use maketrans to create translation table to replace punctuations, digits and white space characters (eg. \r) with blanks
    # maketrans map each character to another character in a string so it doesnt work on words. That's also why we have to have the same number of characters
    remove_char = str.maketrans(string.punctuation + string.digits + string.whitespace,
                                ' ' * len(string.punctuation + string.digits + string.whitespace))
    # maketrans table requires strings with similar lengths
    variable = variable.str.translate(remove_char)

    # create list of list for text
    text_list = [x.split() for x in variable]

    # remove and stem words using nested list comprehension
    text_list_clean = [[sno.stem(w) for w in line if (w not in remove_words) and (len(w) >= 4)] for line in text_list]

    # add clean text back to dataframe
    text_series = pd.Series(text_list_clean)
    text_series = text_series.apply(lambda x: ' '.join(x))

    return text_series

train_extract['text_clean'] = process_text(train_extract['text'])
Frequency of texts in each category
To visualize the most common words in each category, we’ll concatenate all texts associated with that site and count the 10 most common words for each site and then for all sites.
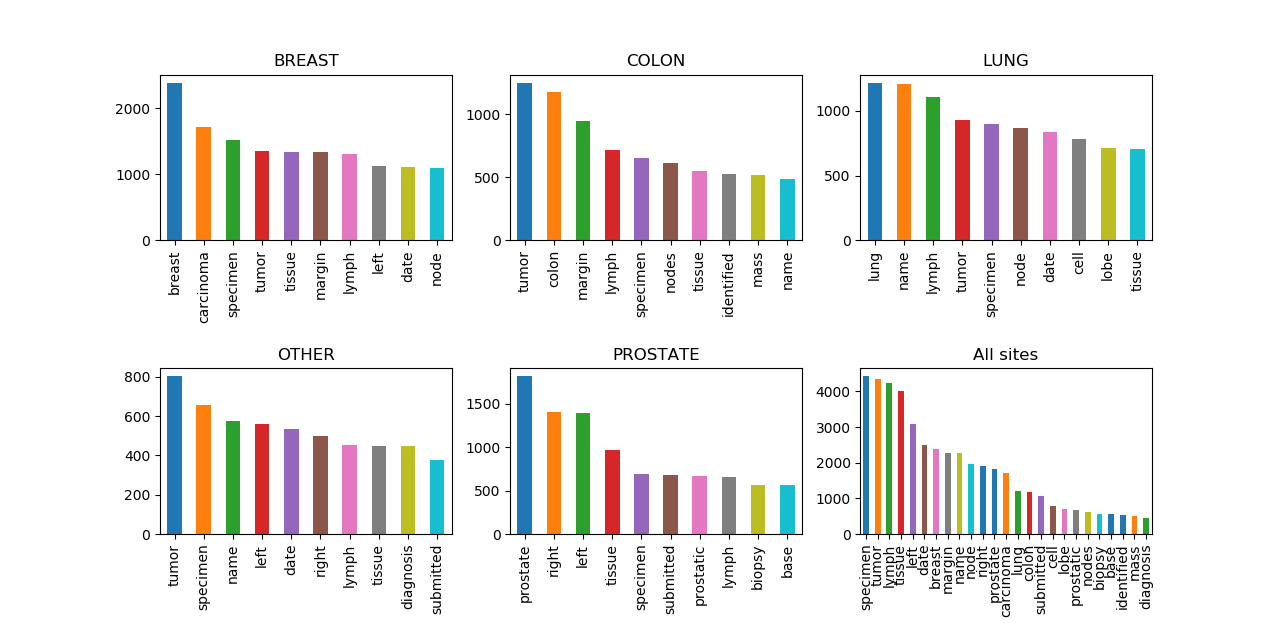
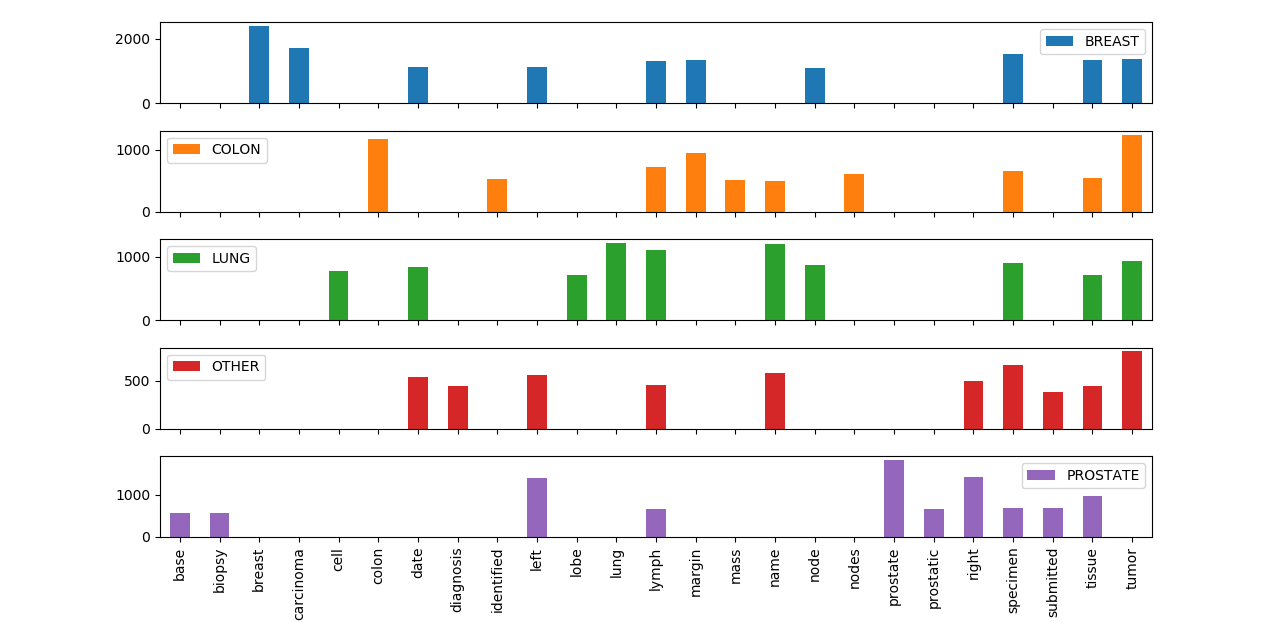
I also made another graph showing the overlapping of common words across sites. We can clearly see that some words like ‘specimen’ or ‘tissue’ are very popular across the sites and they are likely not contributing to classifying the texts. Later we’ll use TF-IDF to help tease out the important words in our models. I tried removing these frequent words but i think the TF-IDF already took care of them so it didnt make a difference to the performance.
# create df of all words by site
train_group = pd.DataFrame(train_extract.groupby(train_extract.SITE).text_clean.sum())


# what are the most common words across sites?
# count the 10 most common words in each label
word_frequency = train_group.text_clean.apply(lambda x: collections.Counter(x.split()).most_common(10))
# word_frequency_test[4]
del train_group

# create subplot for each site
fig, ((ax1,ax2,ax3),(ax4, ax5, ax6)) = plt.subplots(nrows=2, ncols=3)
subplot_list = [ax1,ax2,ax3,ax4,ax5,ax6]

# loop through each dictionary pair and plot common words for each site
# concat the sites together and plot the most common words for all sites
char_to_idx = {site:i for site, i in enumerate(word_frequency.index)}
def df_for_graph(series, col_name):
    df_tot = pd.DataFrame()
    for key, value in char_to_idx.items():
        df = pd.DataFrame(series[key], columns=['word','frequency'])
        df[col_name] = value
        df.plot(ax=subplot_list[key], x='word', y='frequency', kind='bar', title = value, legend=None)
        subplot_list[key].xaxis.label.set_visible(False)
        df_tot = df_tot.append(df)

    df_tot.groupby('word')['frequency'].sum().sort_values(ascending=False).plot(ax=subplot_list[5],
                                                                                           kind='bar', title = 'All sites')
    subplot_list[5].xaxis.label.set_visible(False)
    return df_tot
word_frequency_df = df_for_graph(word_frequency, 'SITE')

# create plot that visualize the most common words between sites
word_frequency_df.pivot("word", "SITE", "frequency").plot(kind='bar', subplots=True, title=['','','','',''])
Machine learning using Naive Bayes and SVM
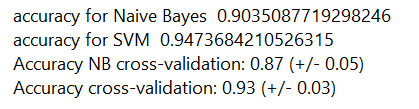
We’ll split the training set into a train and test set. We’ll also do cross-validation on the test set. You can see that the accuracy we get for SVM is pretty high, at 94.7% but with cross-validation the mean accuracy for the model is actually about 93%. The 2 standard deviations put our 95% confidence interval at 90%-96%.
## machine learning step ###
# split into train and test sets
x_train, x_test, y_train, y_test = train_test_split(train_extract['text_clean'], train_extract['SITE']
                                                    , test_size=0.2, random_state=203)


# train model using Naive Bayes
text_clf = Pipeline([('vect', CountVectorizer(#ngram_range=(1, 2),
                                            min_df=1)),
                     ('tfidf', TfidfTransformer(smooth_idf=1)),
                     ('clf', OneVsRestClassifier(MultinomialNB(fit_prior=True, class_prior=None)))])
text_clf = text_clf.fit(x_train, y_train)

accuracy = text_clf.score(x_test, y_test)
print('accuracy for Naive Bayes ', accuracy)


# train model using SVM
text_clf_svm = Pipeline([('vect', CountVectorizer(stop_words='english', ngram_range=(1, 2),
                                                  min_df=1, max_features=None, strip_accents='unicode',
                                                  analyzer="word", token_pattern=r'\w{1,}')),
                         ('tfidf', TfidfTransformer(smooth_idf=1)),
                         ('clf-svm', SGDClassifier(loss='modified_huber',
                                                   penalty='l2',
                                                   class_weight='balanced',
                                                   alpha=1e-3, tol=1e-3, max_iter=50))])
text_clf_svm = text_clf_svm.fit(x_train, y_train)
accuracy_svm = text_clf_svm.score(x_test, y_test)
print('accuracy for SVM ', accuracy_svm)


# count_vect = CountVectorizer(stop_words='english')
# x_train_counts = count_vect.fit_transform(train_extract['text'])
# x_train_counts.shape


# tfidf_transformer = TfidfTransformer()
# x_train_tfidf = tfidf_transformer.fit_transform(x_train_counts)
# x_train_tfidf.shape

cv_results = cross_val_score(text_clf, x_train, y_train, cv=5)
print("Accuracy NB: %0.2f (+/- %0.2f)" % (cv_results.mean(), cv_results.std() * 2))

cv_results_svm = cross_val_score(text_clf_svm, x_train, y_train, cv=5)
print("Accuracy: %0.2f (+/- %0.2f)" % (cv_results_svm.mean(), cv_results_svm.std() * 2))
Let’s see if we can improve the result using Convolutional Neural Networks.
Convolutional Neural Networks
Word embedding
from keras.preprocessing import text
from keras.preprocessing.sequence import pad_sequences
from keras.utils import to_categorical
from keras.layers import Dense, Input, GlobalMaxPooling1D, Activation, Flatten
from keras.layers import Conv1D, MaxPooling1D, Embedding,Dropout
from keras.models import Model
from keras.models import Sequential
from keras.preprocessing.text import Tokenizer


# parameters
MAX_SEQUENCE_LENGTH = 1000
MAX_NUM_WORDS = 20000       # maximum number of words to keep, based on word frequency
EMBEDDING_DIM = 300         #dimension of the pre-trained word vectors
VALIDATION_SPLIT = 0.2


GLOVE_DIR = os.path.join(working_dir, os.pardir, 'glove.6B')

print('Indexing word vectors.')
embeddings_index = {}
with open(os.path.join(GLOVE_DIR, 'glove.6B.300d.txt'), encoding='utf-8') as f:
    for line in f:
        values = line.split()
        word  = values[0]
        coefs = np.asarray(values[1:], dtype='float32')
        embeddings_index[word] = coefs
        # embeddings_index is a dictionary with the key being a word and the value being an array of embedding values
        #400,000 word vectors

print('Found %s word vectors.' % len(embeddings_index))
Tokenizing the texts and applying word embedding
# tokenizer.fit_on_texts looks at all the words in the corpus, assign index to unique words
# then tokenizer.texts_to_sequences converts the words in the corpus to the index which has been identified
tokenizer = Tokenizer(num_words=MAX_NUM_WORDS)
tokenizer.fit_on_texts(clinical_texts)
sequences = tokenizer.texts_to_sequences(clinical_texts)

word_index = tokenizer.word_index
print('Found %s unique tokens.' % len(word_index))
# 4940 unique tokens

data = pad_sequences(sequences, maxlen=MAX_SEQUENCE_LENGTH)
# shrink each of the 4000 text to 1000 numbers. Each number is the word index learned in the tokenization step

labels = to_categorical(np.asarray(labels))     #one-hot vectors for label categories
print('Shape of data tensor:', data.shape)      #1136,1000
print('Shape of label tensor:', labels.shape)   #1136,5


print('Preparing embedding matrix.')
# prepare embedding matrix
num_words = min(MAX_NUM_WORDS, len(word_index) + 1)
embedding_matrix = np.zeros((num_words, EMBEDDING_DIM))     #5061,300
for word, i in word_index.items():
    # word is the key, i is the value
    if i >= MAX_NUM_WORDS:
        continue
    embedding_vector = embeddings_index.get(word)
    # find the word in the pre-trained word vector dictionary
    # if the word is not found in the pre-trained word vectors, leave the embedding matrix as 0s
    if embedding_vector is not None:
        # words not found in embedding index will be all-zeros.
        embedding_matrix[i] = embedding_vector

# load pre-trained word embeddings into an Embedding layer
embedding_layer = Embedding(num_words,
                            EMBEDDING_DIM,
                            weights=[embedding_matrix],
                            input_length=MAX_SEQUENCE_LENGTH,
                            trainable=True)
Build and run the model.
# split the data into a training set and a validation set
x_train_cnn, x_val_cnn, y_train_cnn, y_val_cnn = train_test_split(data, labels
, test_size=0.2, random_state=203)
print('Shape of training data:', x_train_cnn.shape) #908,1000/5061
print('Shape of validation data:', x_val_cnn.shape) #228,1000/5061
print('Training model.')
# train a 1D convnet with global maxpooling
sequence_input = Input(shape=(MAX_SEQUENCE_LENGTH,), dtype='int32')
# this is x_train_cnn
embedded_sequences = embedding_layer(sequence_input) #use embedding layer above for sequence_input
embedded_sequences = Dropout(0.2)(embedded_sequences)
x = Conv1D(128, 5, activation='relu')(embedded_sequences)
x = MaxPooling1D(5)(x)
x = Dropout(0.3)(x)
x = Conv1D(128, 5, activation='relu')(x)
x = MaxPooling1D(5)(x)
x = Dropout(0.3)(x)
x = Conv1D(128, 5, activation='relu')(x)
x = GlobalMaxPooling1D()(x)
x = Dense(128, activation='relu')(x)
preds = Dense(len(idx_to_char), activation='softmax')(x)
model = Model(sequence_input, preds)
model.compile(loss='categorical_crossentropy',
optimizer='adam',
metrics=['acc'])
history = model.fit(x_train_cnn, y_train_cnn,
batch_size=64,
epochs=10,
validation_data=(x_val_cnn, y_val_cnn))
model.summary()
# graph
acc = history.history['acc']
val_acc = history.history['val_acc']
loss = history.history['loss']
val_loss = history.history['val_loss']
epochs = range(1, len(acc) + 1)
plt.plot(epochs, acc, 'b', label='Training acc')
plt.plot(epochs, val_acc, 'r', label='Validation acc')
plt.ylabel('Accuracy score')
plt.xlabel('Number of times model is trained')
plt.title('Training and validation accuracy - With larger word embedding size')
plt.legend()
plt.figure()
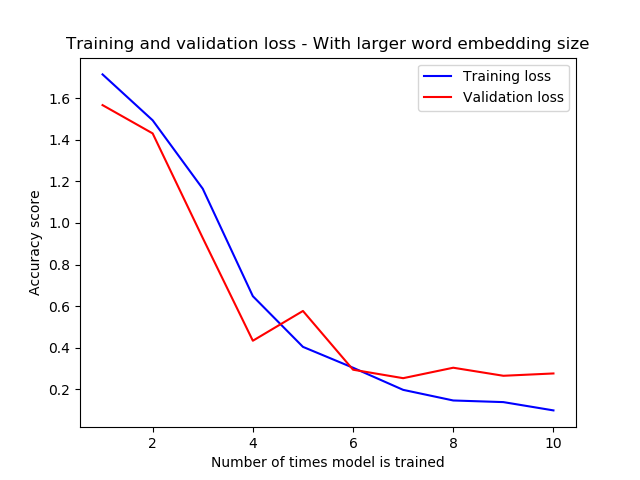
plt.plot(epochs, loss, 'b', label='Training loss')
plt.plot(epochs, val_loss, 'r', label='Validation loss')
plt.ylabel('Accuracy score')
plt.xlabel('Number of times model is trained')
plt.title('Training and validation loss - With larger word embedding size')
plt.legend()
Accuracy for validation set increased and loss decreased nicely.
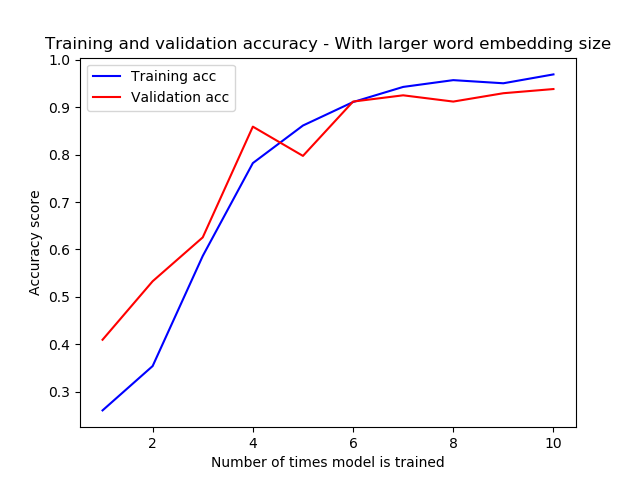
However, the performance that I get is not superior to SVM. CNN also takes a long time to train so it’s more time-consuming to tune the parameters. But as mentioned previously, we can use both methods to find the ambiguous cases that will need the attention of a cancer registrar.